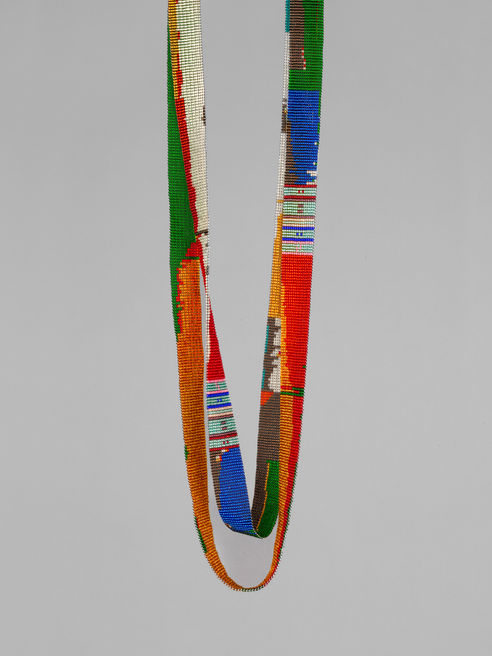
GENOME BEADWORK 2024
Marigold is honoured to collaborate for a second time with scientists at the Sydney Brenner Institute for Molecular Bioscience (SBIMB), University of the Witwatersrand. This new design marks and celebrates the tenth year of the Institute, translating into beadwork interpretations of recent genetic data visualisations.
The genetic admixture that can be read in the data suggests population overlaps in terms of ancestry and gives insight to the complex history of population migrations – in this case to help understand population movements in Africa over the last 5000 years.
Whilst both the scientific data graphs and the beaded representations are abstractions, the translation into tactile handmade wearable art is a tangible reminder of the humans represented by the data.

The top panel, divided into three sections, is a scientific data graph mapping samples of sequenced DNA from individuals from different populations in Africa, Asia, Europe, and the Americas. These admixture charts are used to understand the differences and continuities between human populations within and between different continents.
The three sections show the same data set, generated using a different hypothesis about the number of human ancestral groups that contributed to these populations. Each column represents a person, and each colour represents a different ancestry. Reading from left to right the sections show the genetic admixture of individuals in the represented population groups: in the first section if there were three, in the second if there were six and in the third section if there were nine different ancestries.
In the middle panel – a pixelated translation of the data into a pattern for the Marigold beaders – the three data sections are divided by small panels of beadwork with the letters SBIMB to mark the tenth year of the Institute. The process of pixelation into a pattern for the desired size of the necklace has meant that some of the data has been either reduced or exaggerated in this step.
The final panel is the resulting beaded version of the data, represented in a long flat panel, ultimately to be joined into a pure loop of loomed beadwork to be worn around the neck, long, or doubled. Using this template several necklaces have been created, each one in a different nine-colour interpretation, reinforcing the uniqueness, individuality, diversity, specificity, and variety of humans.
The new genome designs have been created in three different styles: As a single extra-length broad necklace capturing, all together, the data set represented if there were three, six and nine different ancestries; as a single shorter length broad necklace whereby each piece shows the data set represented if there were three, six, OR nine ancestries and as a single shorter length narrow necklace which shows the data set represented as if there were six ancestries.


